How often does this happen while you are writing Apex code in Visual Studio Code (VS Code)? You have written your new method, you have created some awesome tests, you deploy to your dev org and the test fails! You read through your code and can’t spot the source of the bug. What next?
Thankfully Salesforce has provided an excellent debugging experience in VS Code. This article describes the basics of using this debugger.
To follow along, you will need to have already set up VS Code to develop Apex code. If you haven’t, follow this trailhead Quick Start: Visual Studio Code for Salesforce Development.
The example code
This is the simple apex class that I created.
public with sharing class SimpleApex {

    // A simple class that takes an Account SObject and changes the
    // modifies the Name to add the suffix ' - Apex Rocks!'
    public static void changeAccountName(Account account) {
        // add the suffix ' - Apex Rocks!' to the Name field
        account.Name = prependApexRocks(account.Name);

        // Update the Account
        update account;
   }

   // Append ' - Apex Rocks!' to the input parameter and return it
   private static String prependApexRocks(String name) {
        String result = 'Apex Rocks!! ' + name;
        return result;
   }
}
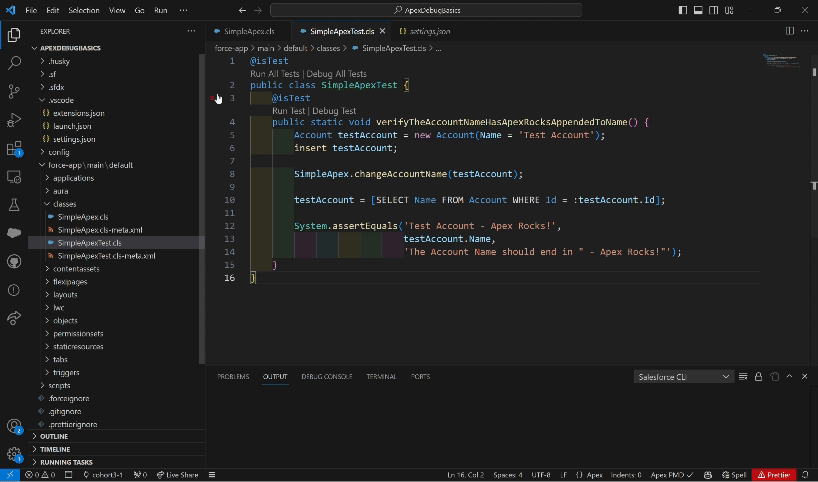
Here is the test I created to validate the code.
@isTest
public class SimpleApexTest {
    @isTest
    public static void verifyTheAccountNameHasApexRocksAppendedToName() {
        Account testAccount = new Account(Name = 'Test Account');
        insert testAccount;

        SimpleApex.changeAccountName(testAccount);

        testAccount = [SELECT Name FROM Account WHERE Id = :testAccount.Id];

        System.assertEquals('Apex Rocks! Test Account',
                            testAccount.Name,
                            'The Account Name should start with "Apex Rocks!"');
    }
}
If you create these two apex files in a dev org, you can play along.
Once they are deployed, I run the test, and it fails. All that effort and I have a bug. I read through the code, and let’s pretend I can’t see the bug on line 15 of the code.
How can I find the bug?
There are two ways that you can do this.
- Output debug statements using
System.Debug.
In my method changeAccountName you could add System.Debug(account.Name) before and after the call to appendApexRocks method. You can then look through the logs to see what happened. One of the negatives of this method is you need to “guess” the best place for the debug statements. If you miss where the bug is, you have to add more debug statements or more detail or both.
- Use the VS Code IDE Apex debugging tool.
This method provides you with rich information about the state of the code without adding additional code that may obfuscate your main code. It will show you the value of the variables at each step in the process. No more guessing where to put debug statements.
Using Apex debugger in VS Code
With your VS Code setup as described earlier, using the debugger is really simple to get started.
1. Add a breakpoint in the IDE.
If you move your mouse to the right of the line numbers, you will see a dim red dot appear. If you click you will see the dot turn bright red, and you have created a breakpoint.
2. Click on Debug Test above the test, verifyTheAccountNameHasApexRocksAppendedToName, to run in debug mode.
VS Code will change some of the sections of the screen to show the debug specific windows.

The debug specific UI includes:
- The run and debug view. This is where you can see the values of variables and where the breakpoints are listed.
- The highlighted line shows where the process is currently at.
- The Debug Console shows the Apex debug log output.
- The debug palette. This allows you to control how you want to step through the code.
Stepping through the code
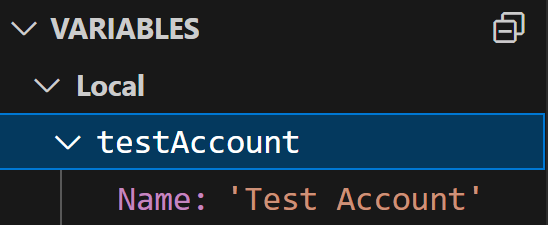
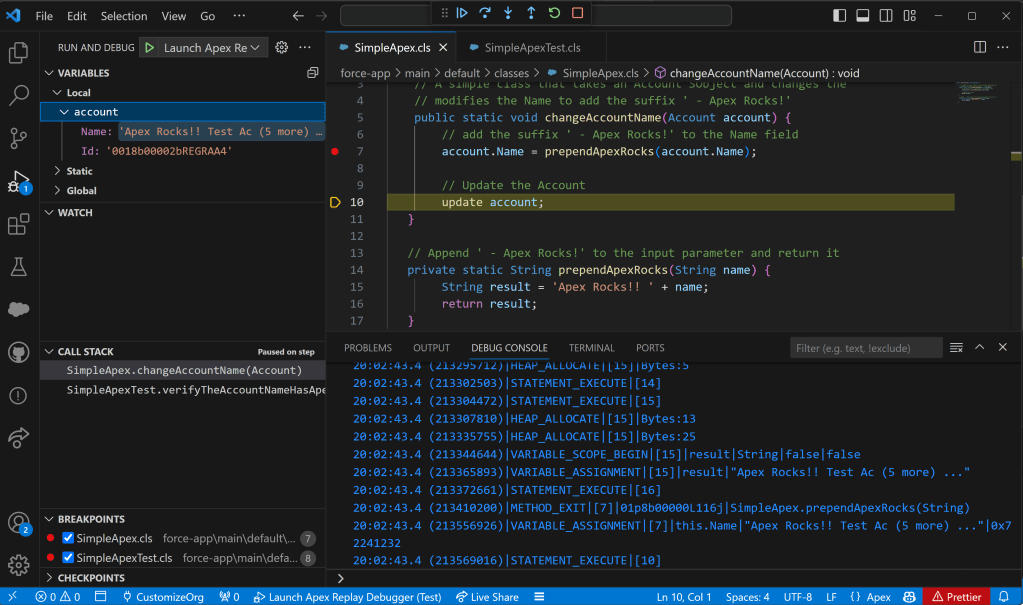
If you are following along at home, the code should be stopped at line 8 of the test and is highlighted in the IDE. If you look at the debug window, you should see an entry for testAccount. You can expand this and see the current values of the testAccount member variable.
Next, click the run to next breakpoint ![]() button on the debug palette. The code will now show the SimpleApexClass with line 7 highlighted.
button on the debug palette. The code will now show the SimpleApexClass with line 7 highlighted.

Click the step into button  on the debug palette. The code will move to the method signature for
 appendApexRocks.
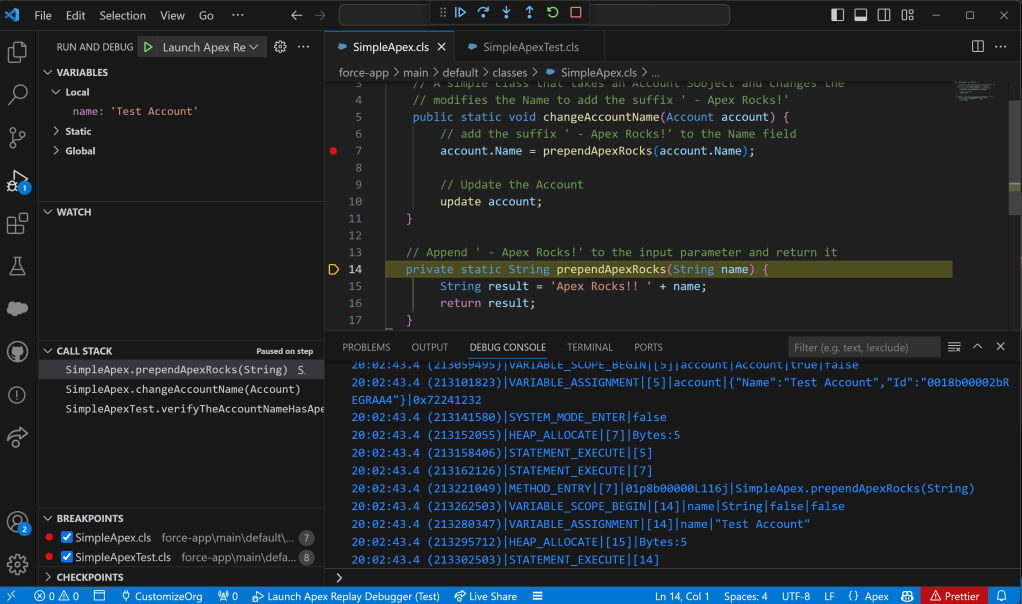
Click on the step over button  twice.

Looking in the local variables in the left panel we can see that the result starts with ‘Apex Rocks!!’. We are expecting ‘Apex Rocks!’. Perhaps this is why the test is failing.
Click on the step over button
Looking at the Account.Name it now starts with ‘Apex Rocks!!’. Yep, it looks like we have found the bug. Let’s just run the test to completion by clicking the run to next breakpoint button ![]() .
.
Fix the code on line 15 by removing the duplicate ‘!’. Deploy the code and run the test again. Success! Celebrate your success by commit the code with a happy message.
What next
Debugging is an important skill for any developer to learn. There are many approaches to debugging, and I hope this introduction to debugging Apex in the VS Code IDE will help you accelerate your learning.
So, try this with your next Apex project. Try the different debugging controls and see what they do.

Leave a comment